¶ ZABBIX integration
Zabbix API can be consumed using Postman ([https://blog.zabbix.com/zabbix-api-calls-through-postman/12198/ Howto]). Because HTTP Site Monitoring Test is similar to Postman, Zabbix API can be also consumed using HTTP Site Monitoring Test.
IMPORTANT: This is only a basic example of how to use Zabbix API calls through SERVERware HTTP Site Monitoring Tests in a simple environment. Every Administrator should plan HTTP tests carefully based on its own environment and needs.
In this simple example, we had to set up one Zabbix monitoring server and one SERVERware cluster with one Processing host. Zabbix server will monitor SERVERware processing host CPU Load. Using SERVERware HTTP Site Monitoring Test we will create specific POST API requests to the Zabbix server and depending on the API request body response we will use a regular expression to parse specific tags for triggered alarm/s on the Zabbix server.
Step by step explanation how this test works:
- Login to Zabbix and edit the trigger in Monitor > Hosts > [ edit the trigger you like to monitor from Site monitor ]
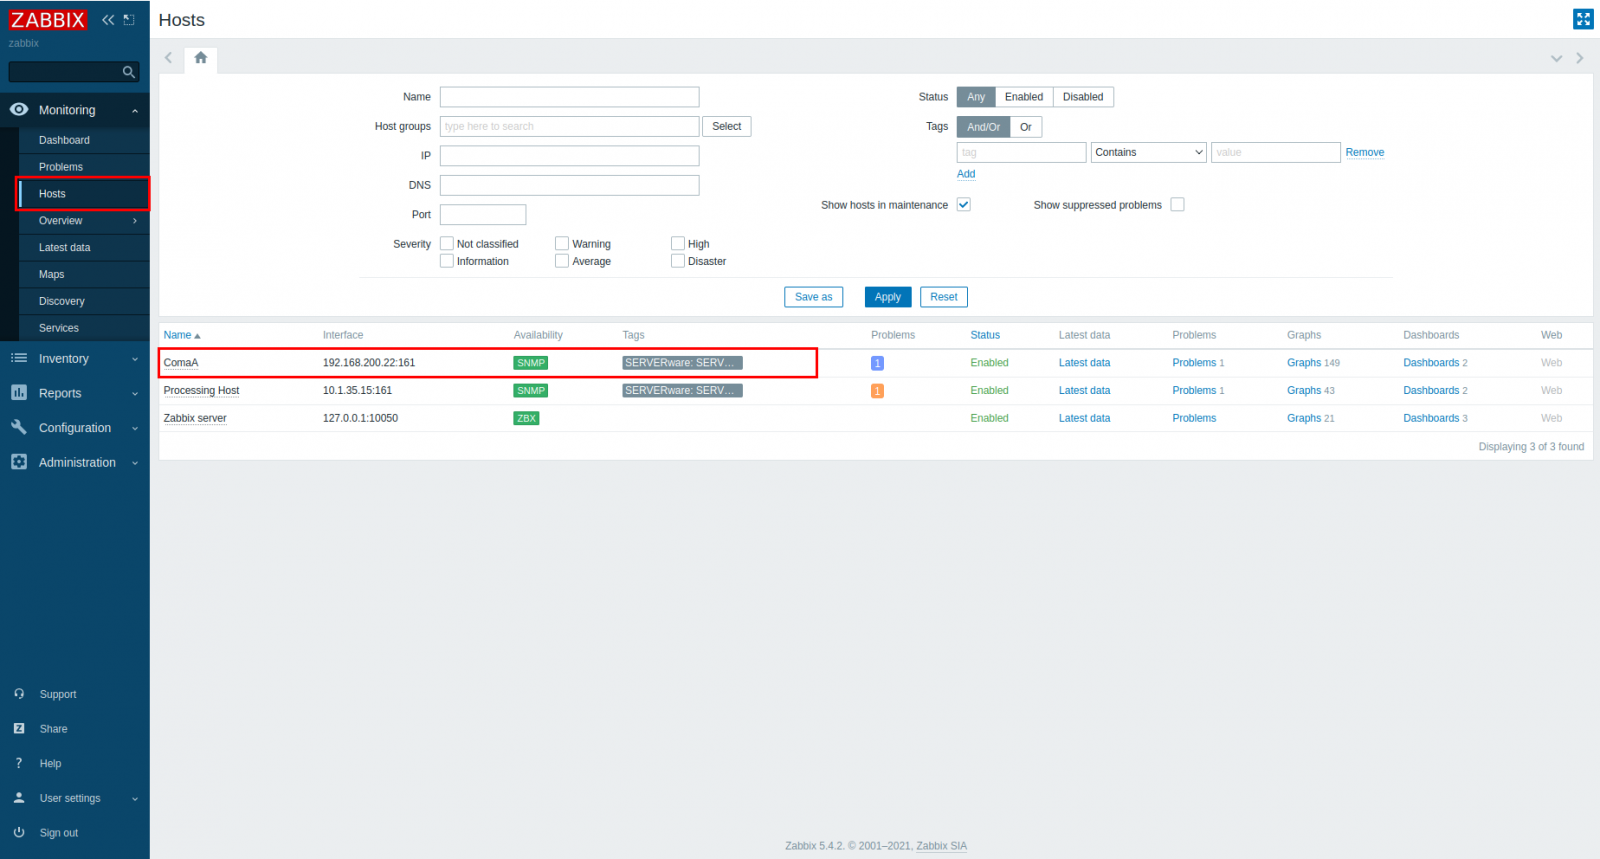
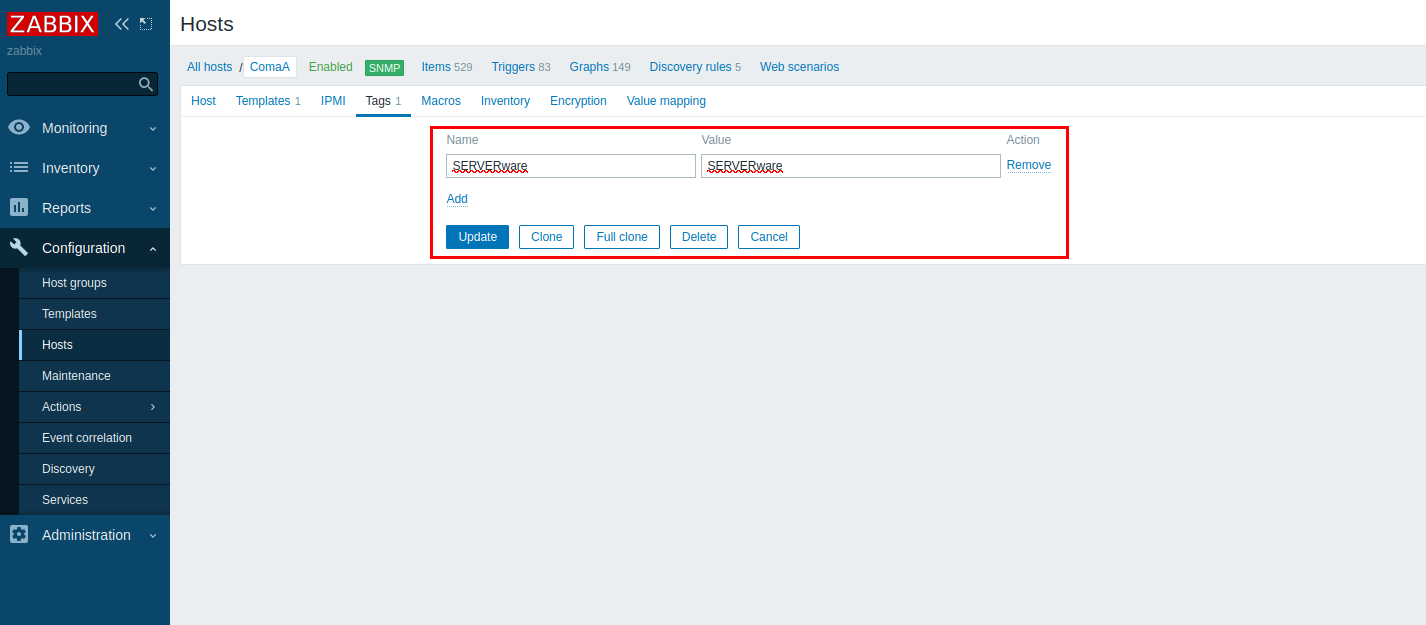
- Edit the trigger and in the Tags, section add some recognizable tag, we will use this tag later in the Site monitoring tool, in the example, we will use the tag "SERVERware"
- Now when we have tagged our triggers, create a permanent API token in the Zabbix we will use this token to access the triggers info from the Site monitor.
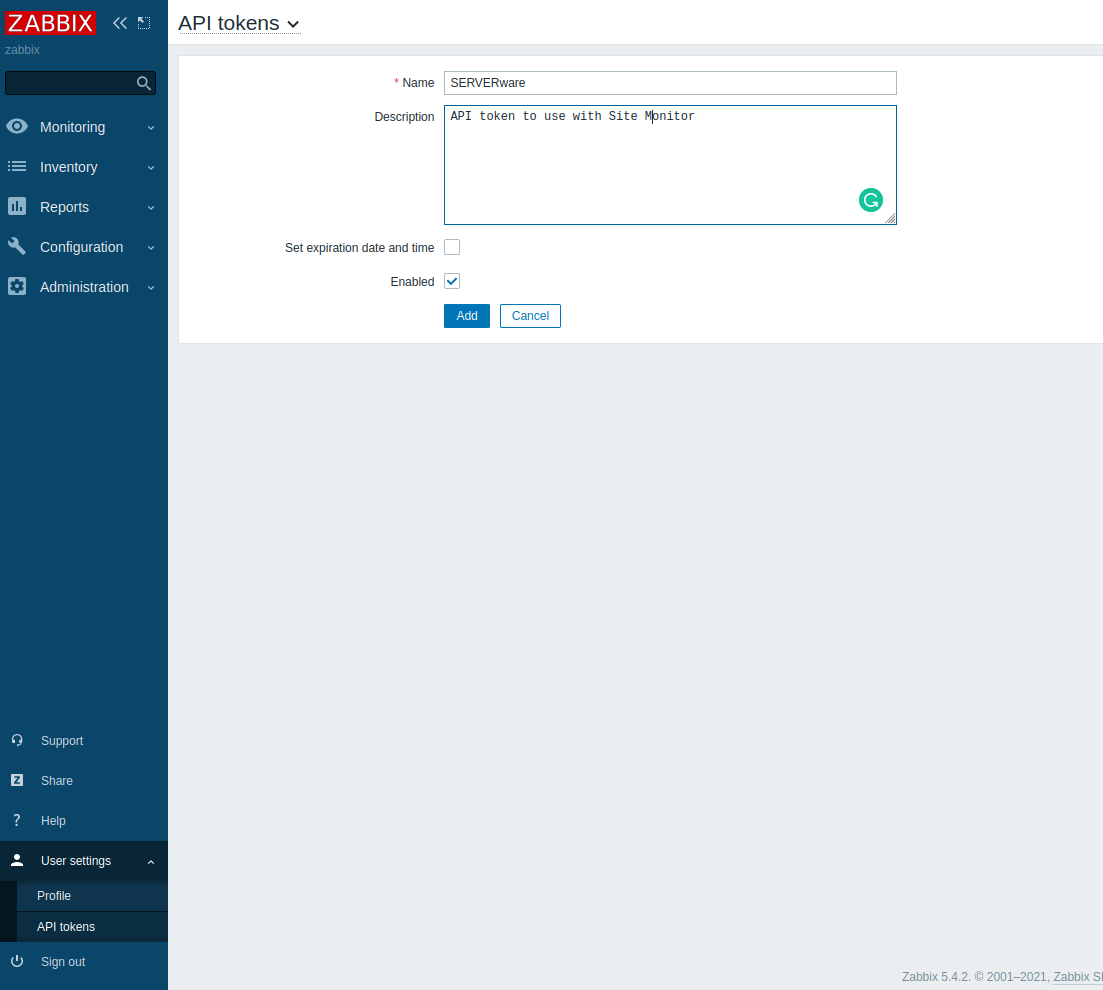
- Enter the name for the API add some description and create a token (don't set expiration date). Remember this Auth token for later use.
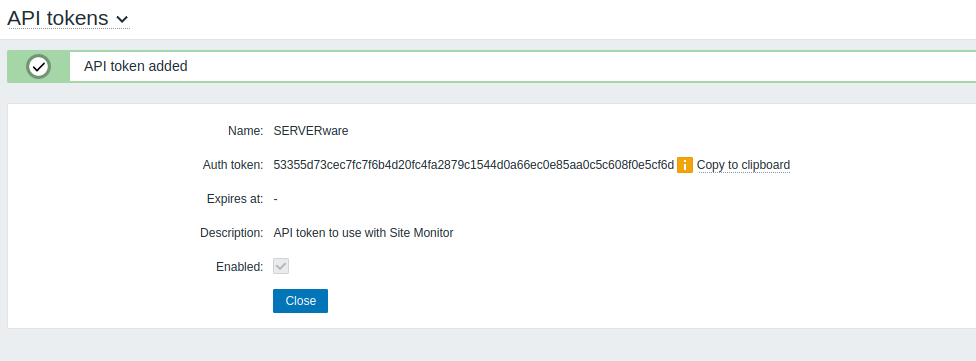
This concludes the configuration inside the Zabbix.
Now open the SERVERware GUI and go to the Site Monitoring > Create Site Monitor.
In the Site Monitoring Name field enter the desired Name for the monitor [In the example we will use the Zabbix trigger].
Set the Schedule time [this represents the time, how often the test will be triggered] and press Save and Apply.
Next, we need to add a New site Test [we will use the HTTP test in this example].
- Press the "New Site Test" button and from the dropdown select HTTP, the popup window will appear.
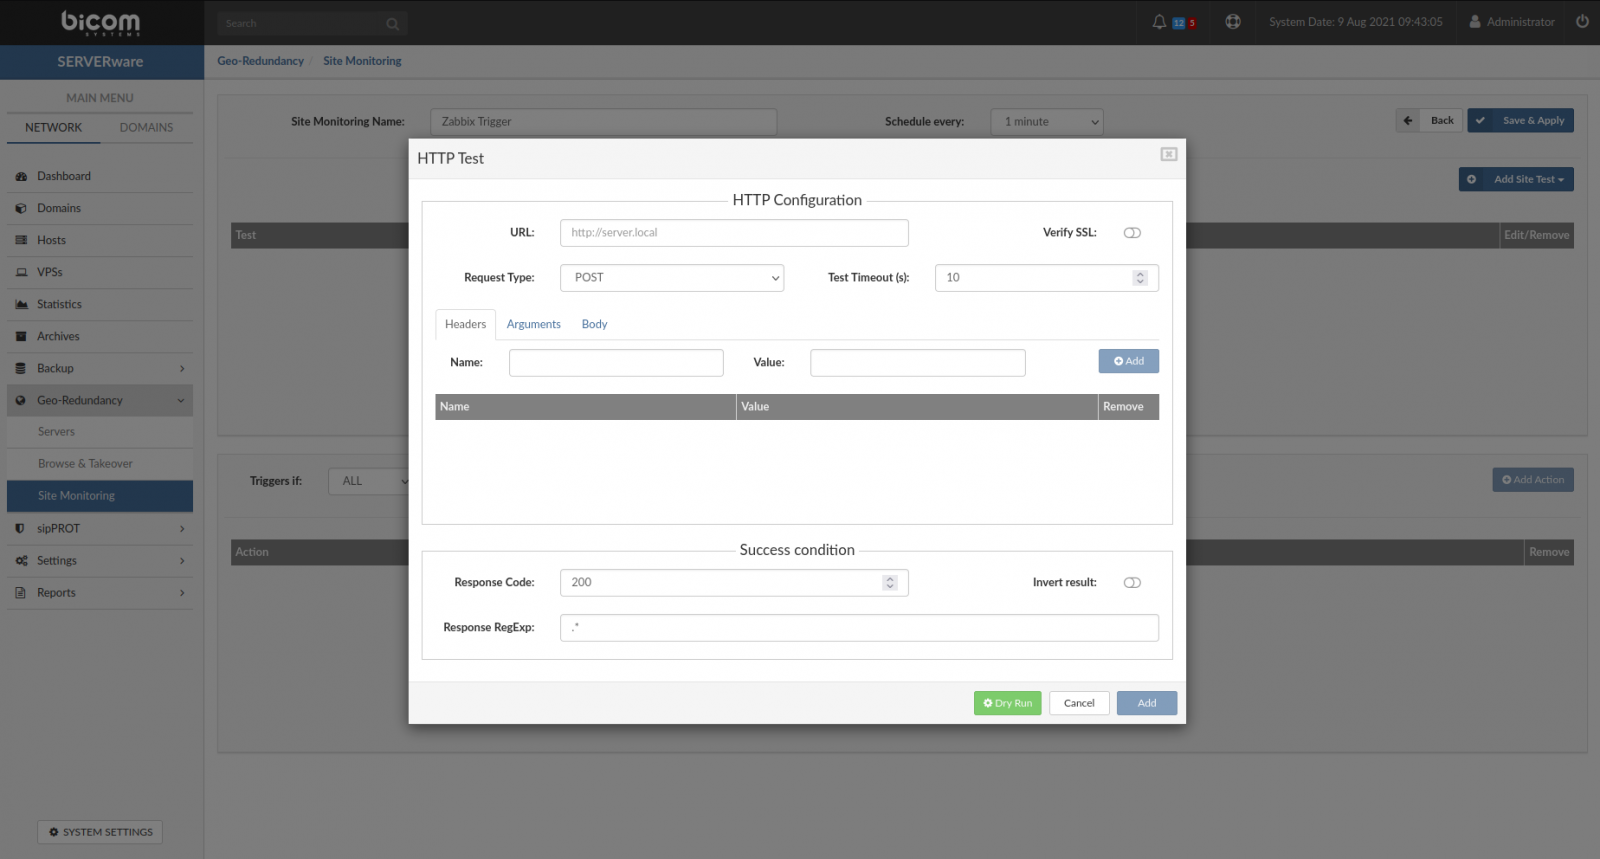
Populate the fields:
URL: http://your zabbix server ip/domain/api_jsonrpc.php
Request Type: POST (Per Zabbix API documentation)
Test Timeout in seconds: 10 [test will wait for the response max 10 seconds after this if no response test will fail]
In the Headers tab, we only need to enter one header.
Name: Content-Type Value:application/json
in the Body Tab we will create a little Json script as per Zabbix API documentation:
 {
 "jsonrpc": "2.0",
 "method": "trigger.get",
 "params": {
      "output": [
          "triggerid",
          "description",
          "priority"
          ],
          "filter": {
              "value": 1
          },
          "sortfield": "priority",
          "sortorder": "DESC"
      },
      "auth": "53355d73cec7fc7f6b4d20fc4fa2879c1544d0a66ec0e85aa0c5c608f0e5cf6d",
      "id": 1
}
- For the auth part of the JSON use the Auth token we have generated earlier in the Zabbix. Now for the success conditions, we will use Response code: 200 [default] and "Response RegExp" we will search for the trigger tag we have created in the Zabbix trigger earlier .*SERVERware
For the test to be valid we have to "Invert" the result of the test so when we actually get the Zabbix response with the matching Regular expression the test will fail and the conditions for our Site monitor will be met. Now we can test our setup by pressing the "Dry Run" button the result should be "Test successful" (at this point make sure your Zabbix trigger is not failing already).
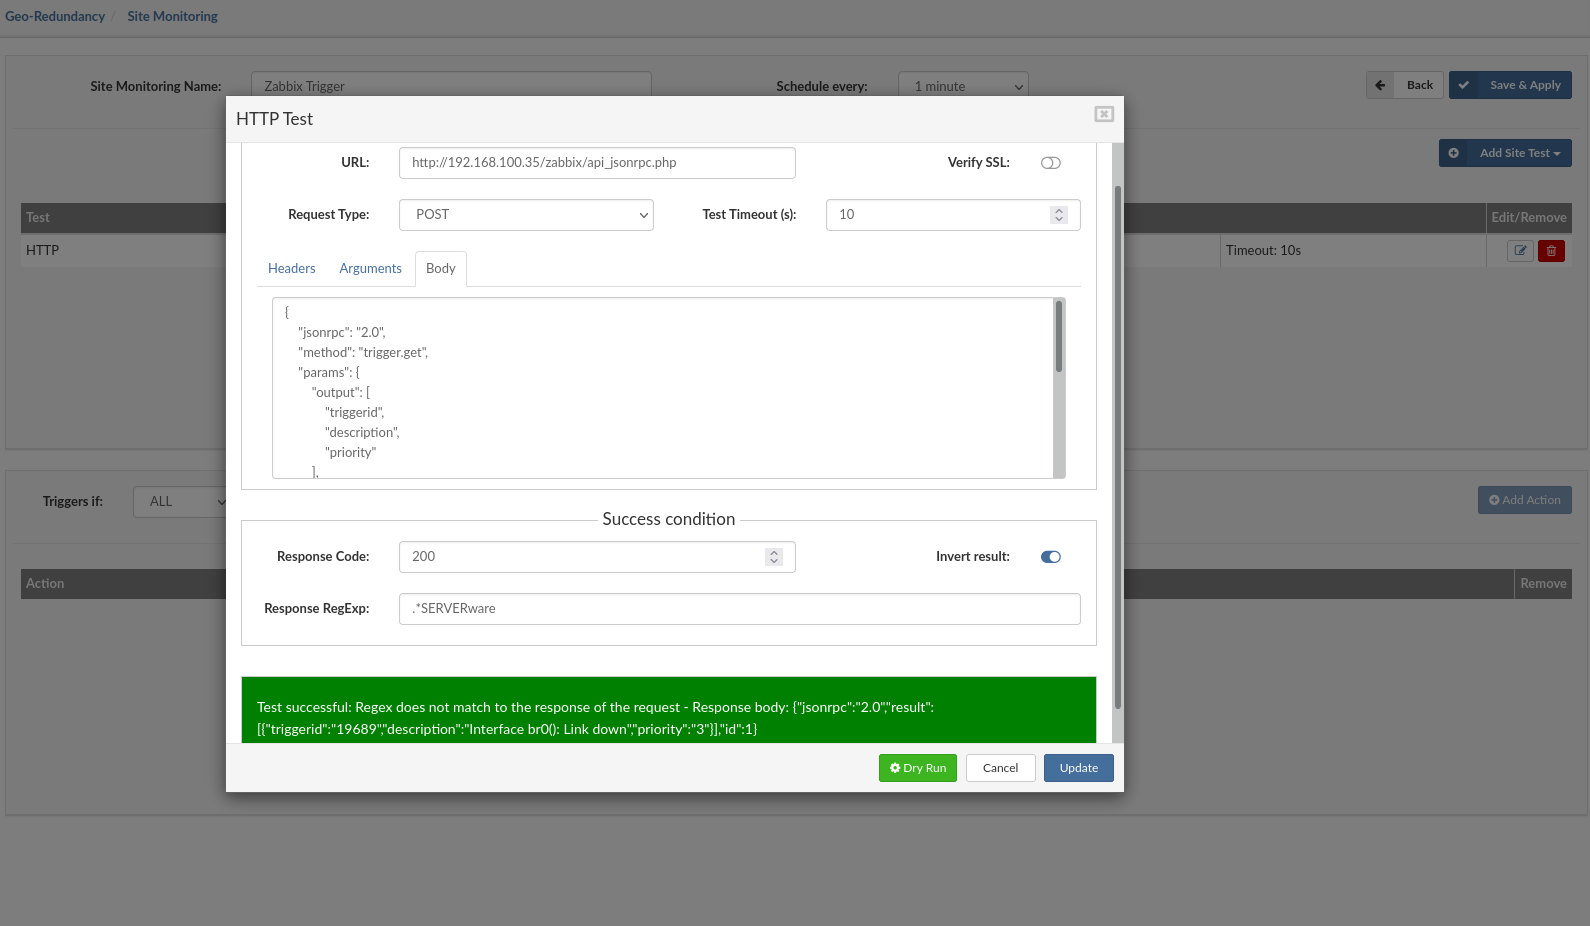
Press the "Update" button and the test will be saved in the test list.
- Now we have to create one more "self-test" to be sure our Site monitor Server is up and running, for we will be using ICMP test to Ping Google, so we will be sure if our site monitoring server is down the actions will not be triggered. Add one more site test and now from the dropdown select ICPM test.
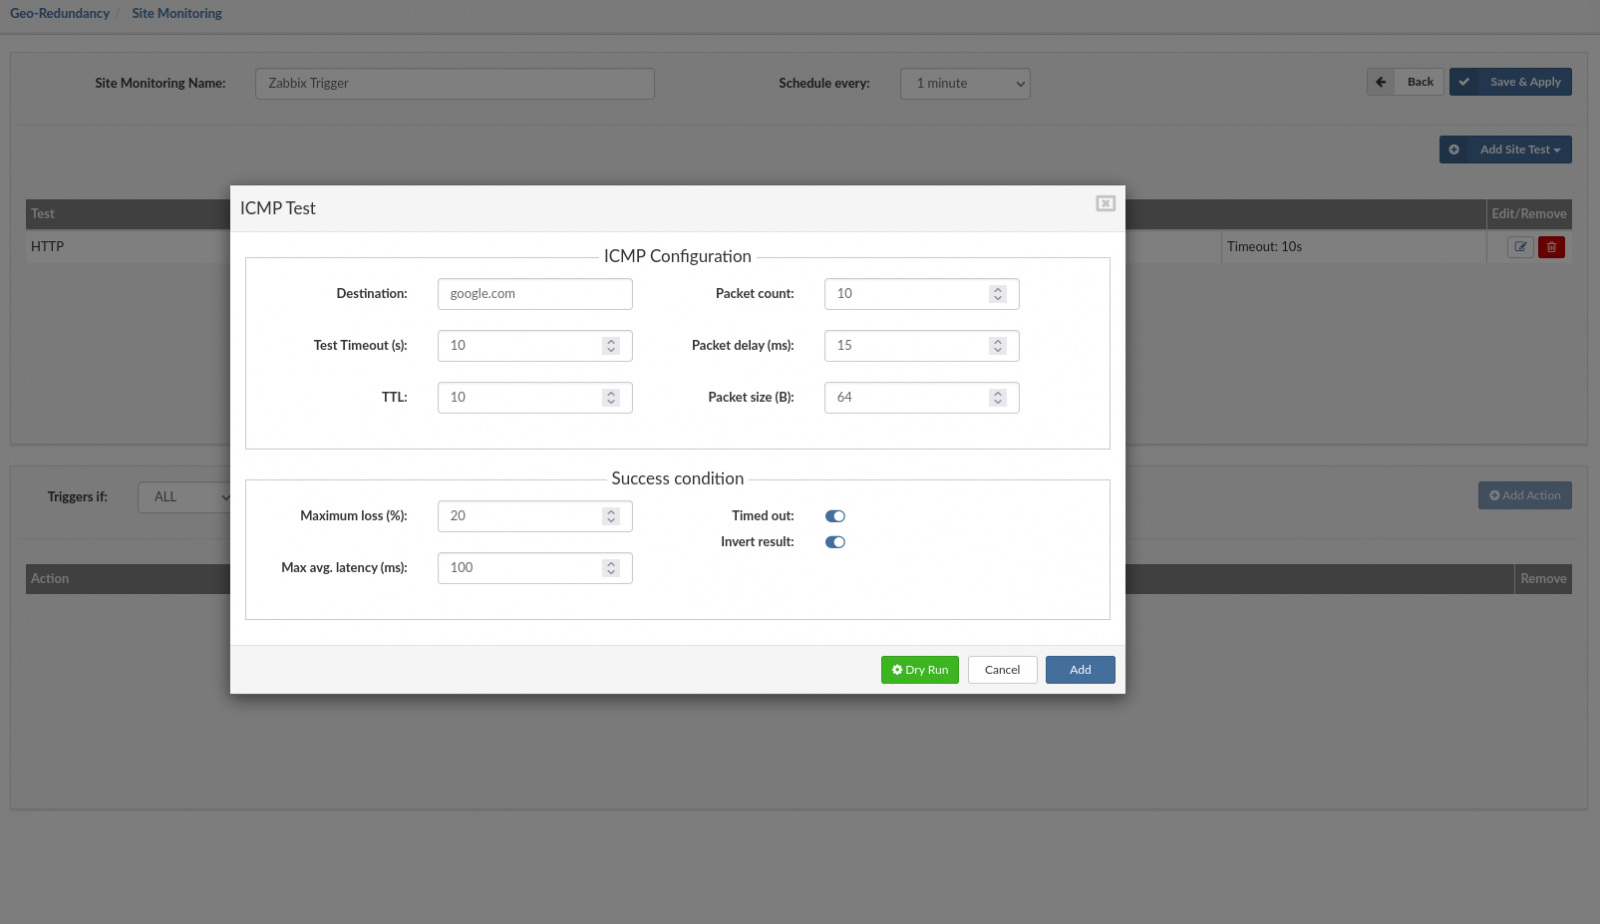
- Make the destination domain/IP to some service that is always available [we will use] and also invert the result so this test will always fail except in the case when the destination is not pingable from our Site monitor service.
Now press Add to add this test to our test list. Next, we need to set up actions, what will happen when our test fails, in the lower part of our Site monitor we have triggers.
Set this Site monitor to trigger the alarm if all test above fail, [we can also choose to execute automatic template takeover in the case when test fail for this the takeover template mus be created prior the action selection]
Set actions:
Triggers if: [ALL] [Alarm] and press add the Action
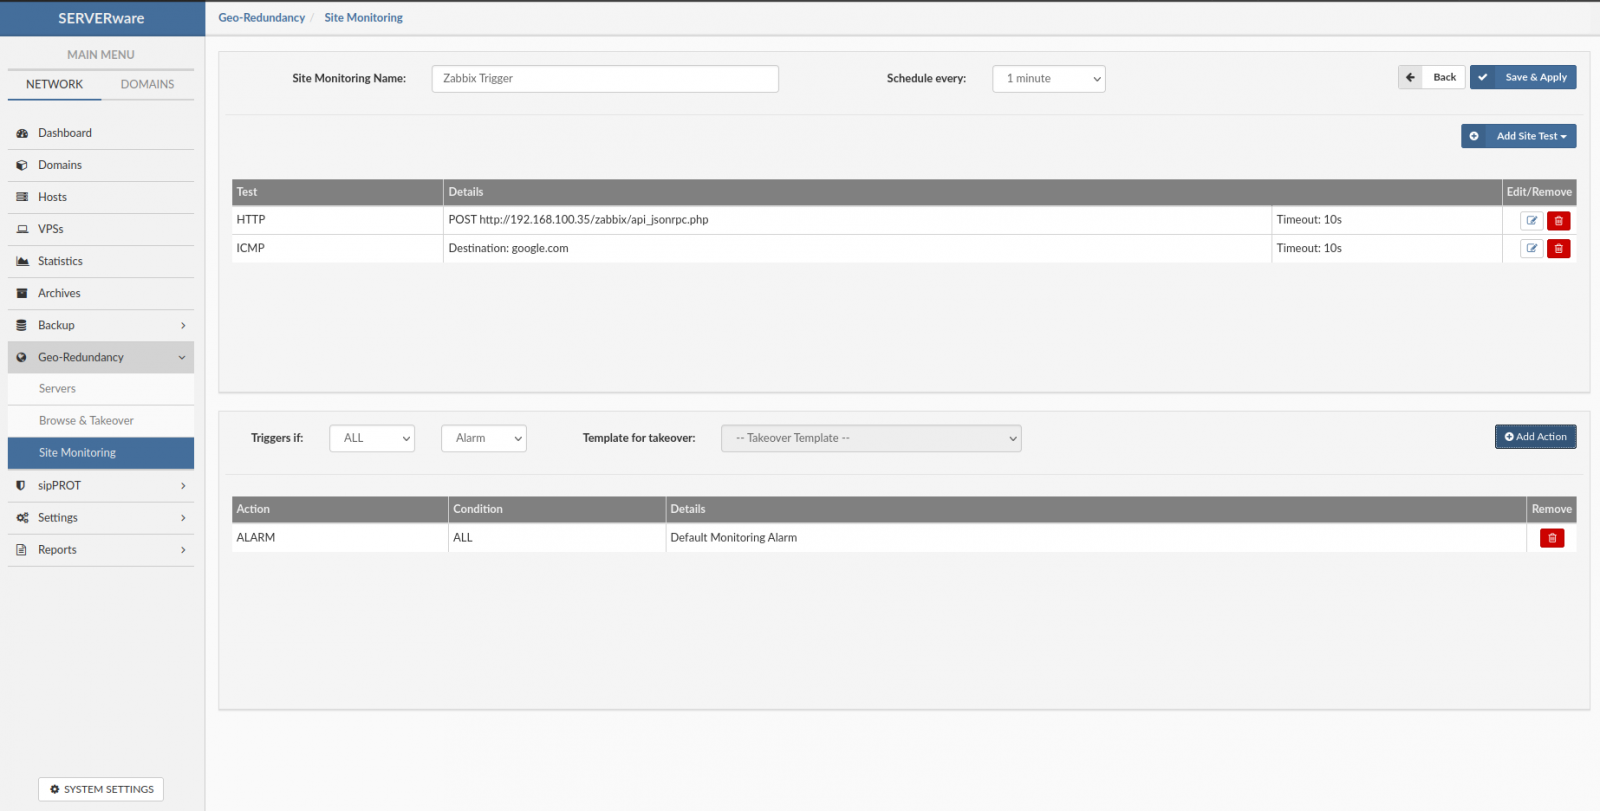
Now we have set up our Site monitor to use Zabbix triggers for executing SERVERware actions, press the save and apply button, and in the Site monitor main menu select newly created monitor and press Start to start monitoring actions.
- Create actions to be triggered if conditions are met

Add Action button : This will add action to the action list with a preselected option
''Trigers if''': Two conditions available '''ALL''' and '''ANY''' and one action '''ALARM'''.
'''ALL''': Trigger alarm only when all tests fail for this site.
'''ANY''': Trigger alarm when any of the tests fail for this site.
'''Alarm''': Select action to trigger when conditions are met.''The Alarm will be displayed on the dashboard, an email notification will be sent to the administrator''
NOTE: Test can be edited/removed with the click on the appropriate icon. Actions can be removed only.