¶ ZABBIX Integration
Zabbix is an open-source monitoring software tool for diverse IT components, including networks, servers, virtual machines (VMs), and cloud services. Zabbix provides monitoring metrics, such as network utilization, CPU load, and disk space consumption. The software monitors operations on Linux, Hewlett Packard Unix (HP-UX), Mac OS X, Solaris, and other operating systems (OSes)... Read more about Zabbix on official site https://www.zabbix.com/documentation/current/manual
IMPORTANT: This is only a basic example of how to use Zabbix API calls through SERVERware HTTP Site Monitoring Tests in a simple environment. Every Administrator should plan HTTP tests carefully based on its own environment and needs.
In this example, we set up a Zabbix monitoring server along with a SERVERware cluster that includes one Processing Host. The Zabbix server will monitor the CPU load of the SERVERware Processing Host. Using the SERVERware HTTP Site Monitoring test, we can create custom POST API requests to the Zabbix server. Based on the responses from these requests, we use regular expressions to parse specific tags and trigger alarms on the Zabbix server as needed.
Zabbix Setup
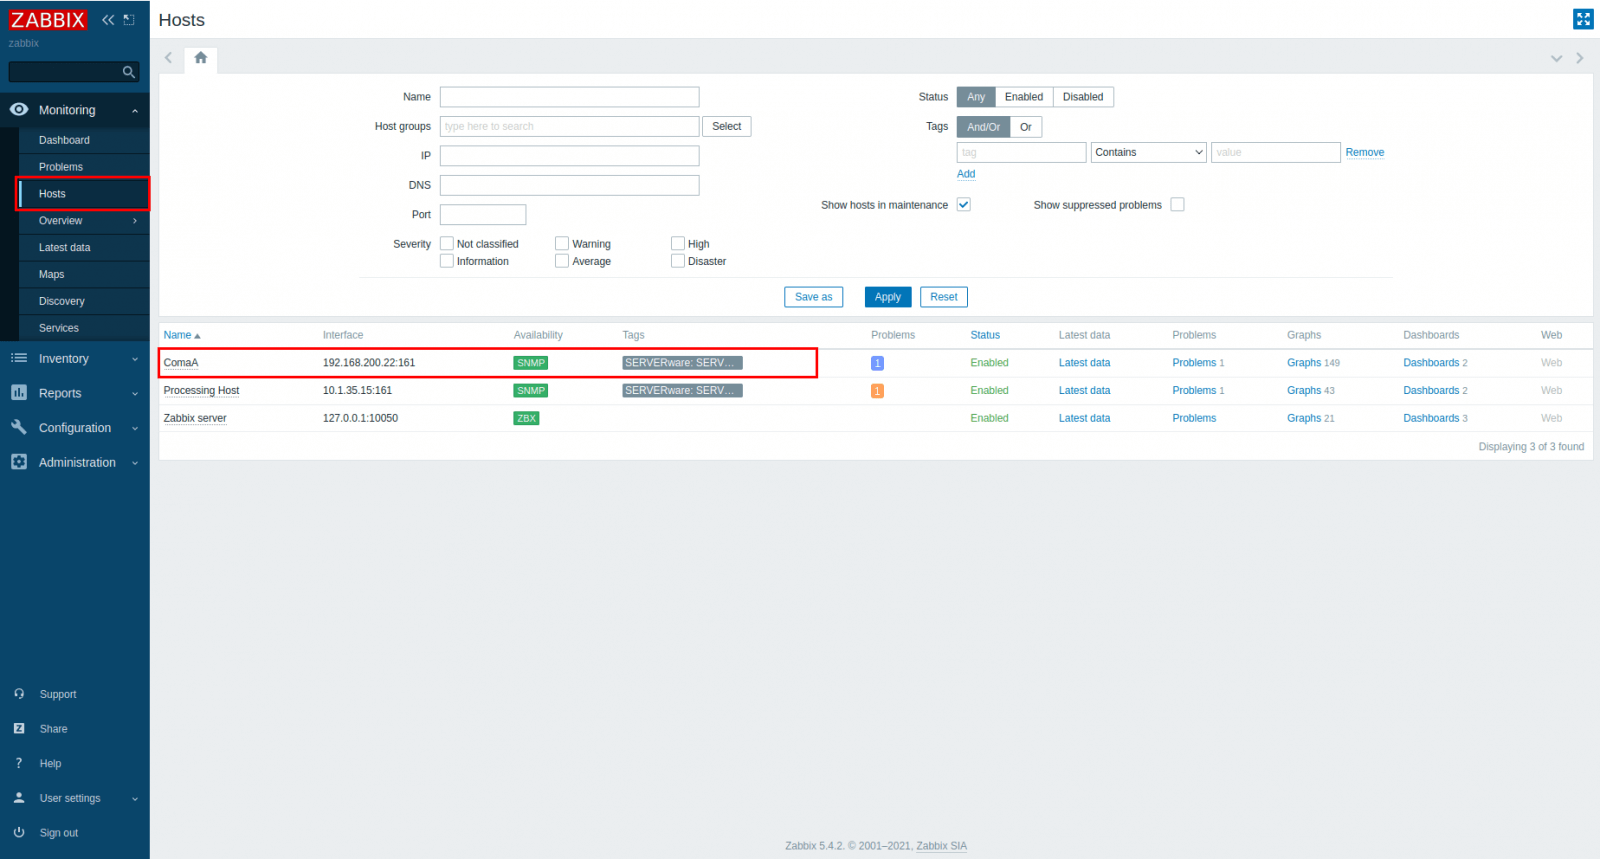
- Log in to Zabbix and go to Monitor > Hosts. Select the host and edit the trigger to monitor from the Site Monitor.
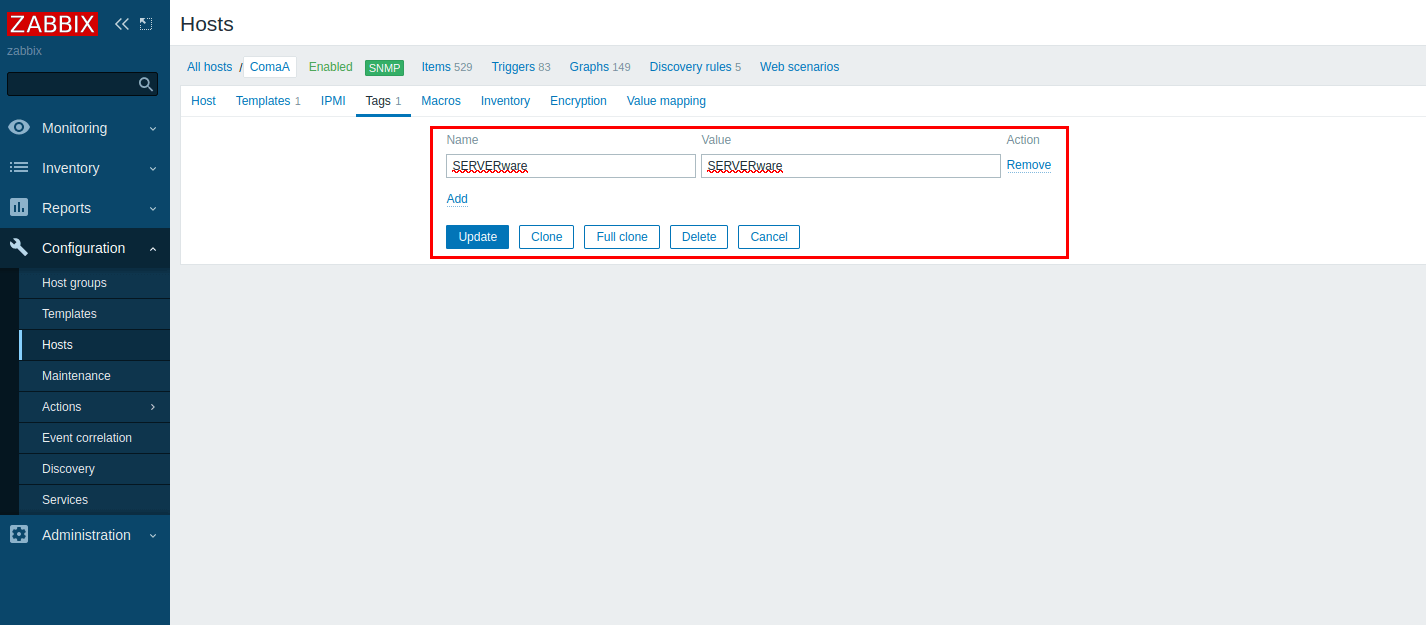
- Edit the trigger and, in the Tags section, add a recognizable tag. This tag will be used later in the Site Monitoring tool. In this example, the tag "SERVERware" is used.
- After tagging the triggers, create a permanent API token in Zabbix. This token will allow the Site Monitor to access trigger information.
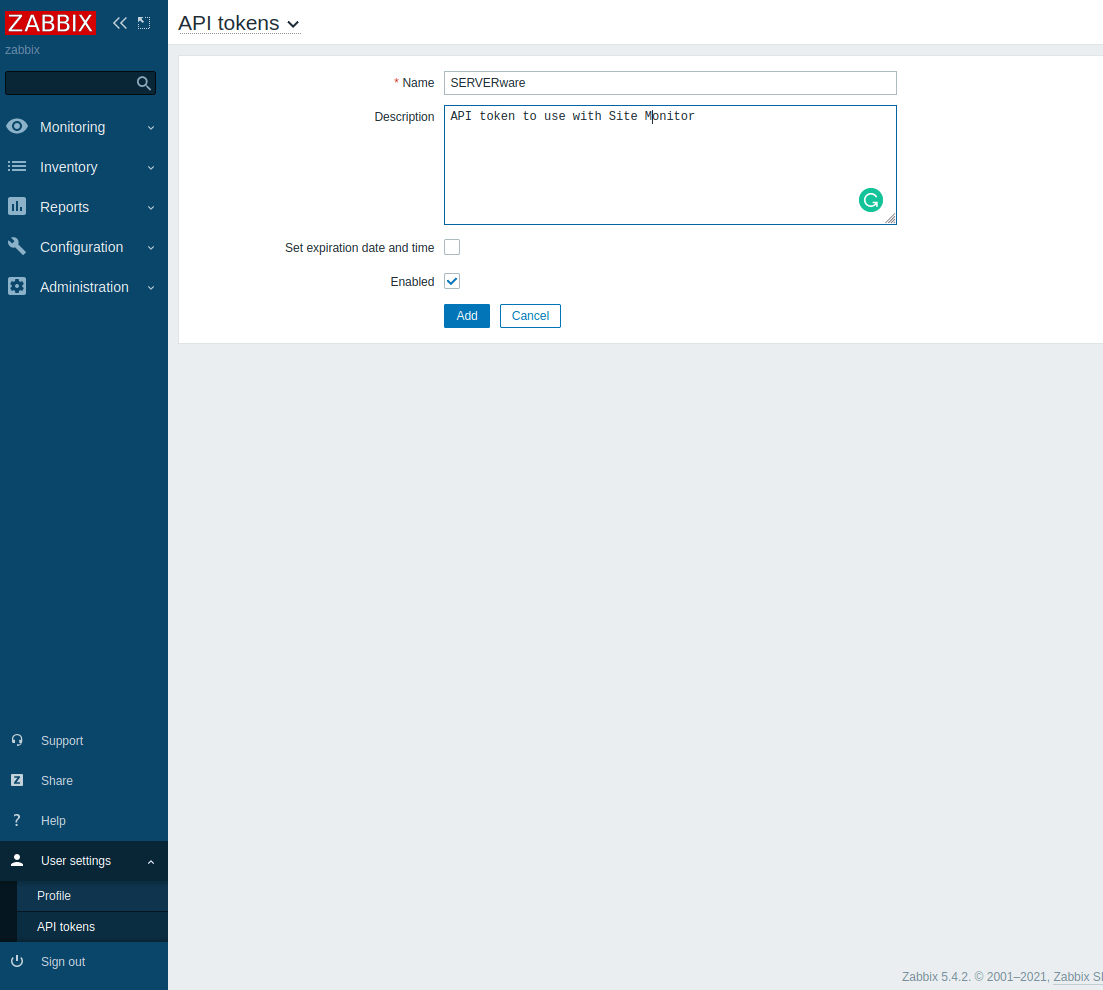
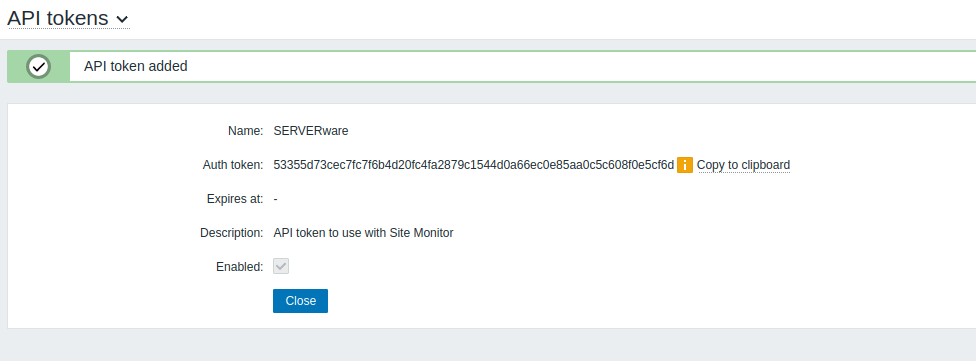
- Enter a name and description for the API token, create it without an expiration date, and save it securely for later use.
This completes the configuration inside Zabbix.
SERVERware Setup
-
Open the SERVERware GUI and navigate to Site Monitoring > Create Site Monitor.
-
In the Site Monitoring Name field, enter a name for the monitor (in this example, the Zabbix trigger name is used). Set the Schedule Time, which determines how often the test will run, and then click Save and Apply.
-
Next, add a new site test using an HTTP test in this example:
-
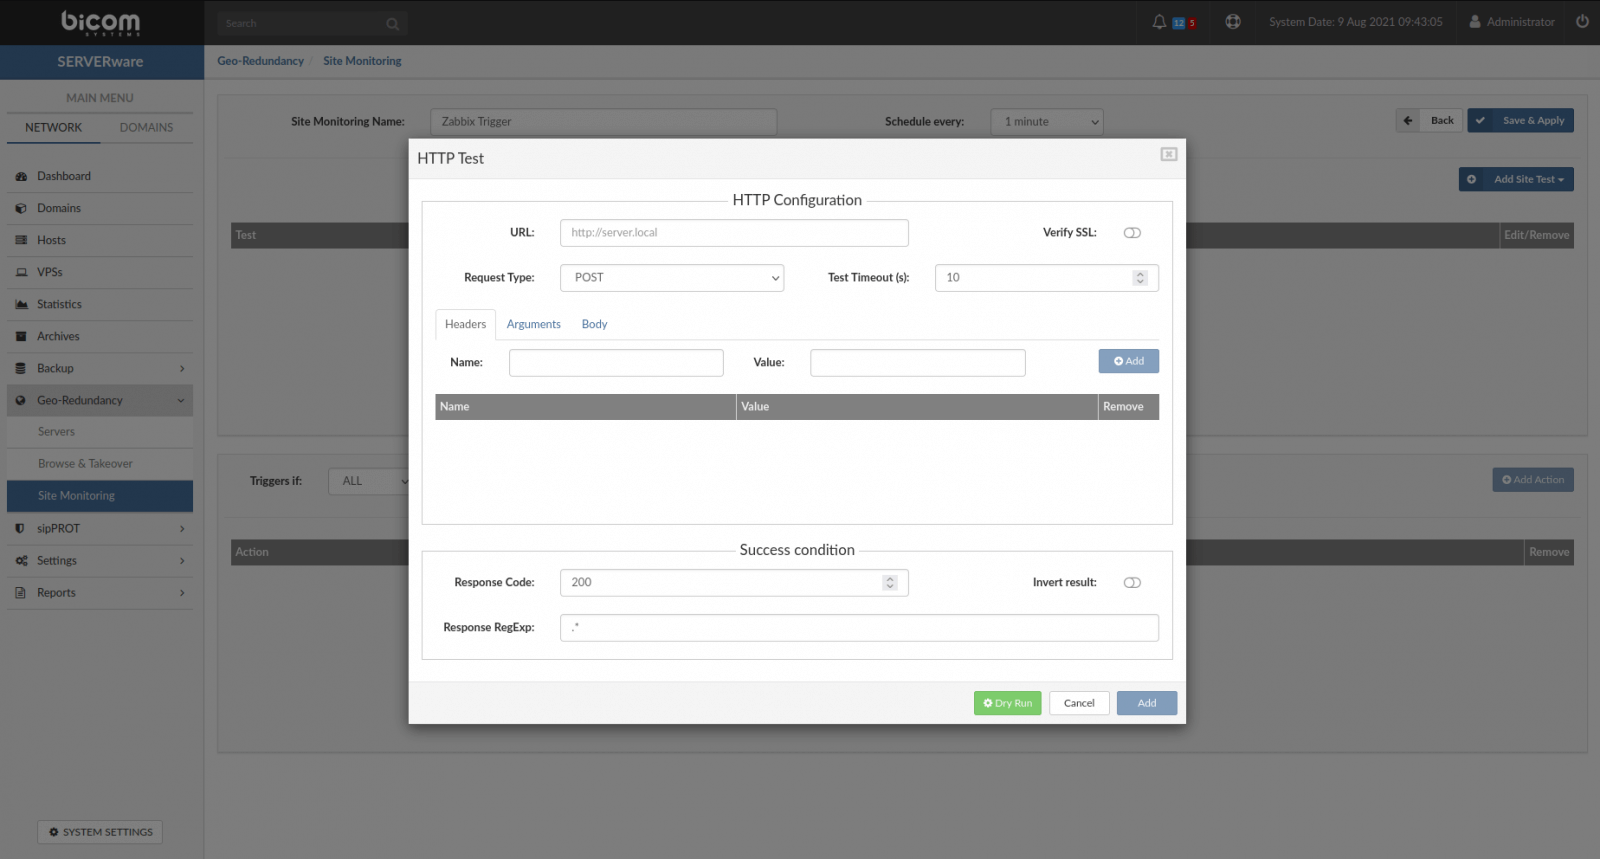
Click the New Site Test button and select HTTP from the dropdown; a popup window will then appear.
-
Populate the fields:
- URL: http://your zabbix server ip/domain/api_jsonrpc.php
- Request Type: POST (Per Zabbix API documentation)
- Test Timeout in seconds: 10 [test will wait for the response max 10 seconds after this if no response test will fail]
-
In the Headers tab, only one header needs to be entered.
- Name: Content-Type
- Value: application/json
-
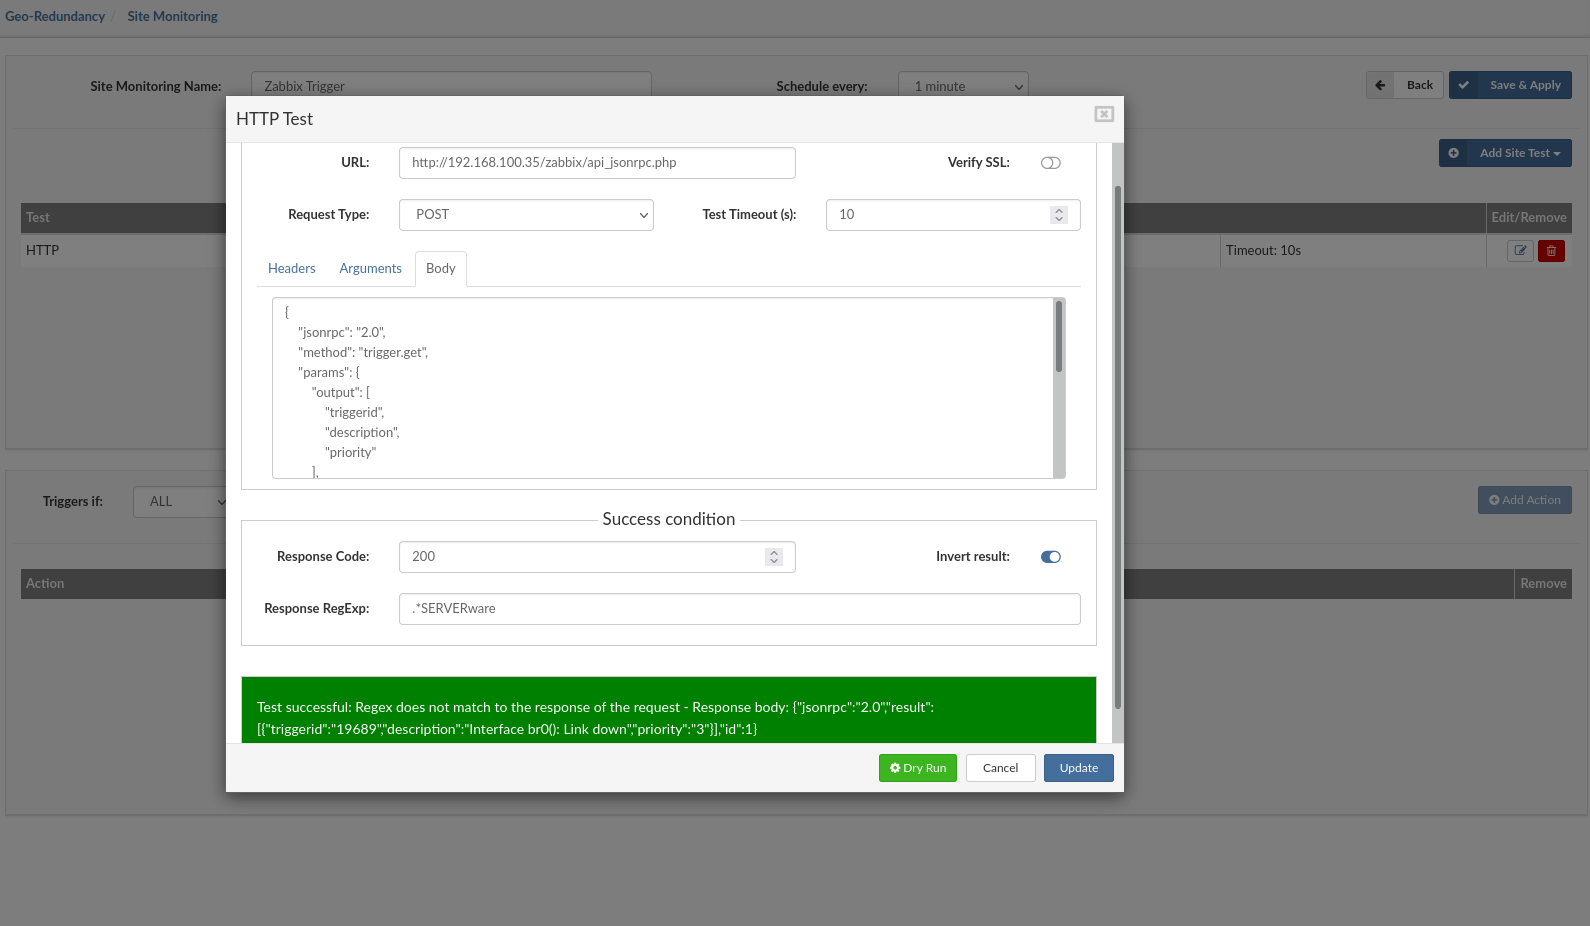
In the Body tab, a small JSON script must be created following the Zabbix API documentation:
 {
 "jsonrpc": "2.0",
 "method": "trigger.get",
 "params": {
      "output": [
          "triggerid",
          "description",
          "priority"
          ],
          "filter": {
              "value": 1
          },
          "sortfield": "priority",
          "sortorder": "DESC"
      },
      "auth": "53355d73cec7fc7f6b4d20fc4fa2879c1544d0a66ec0e85aa0c5c608f0e5cf6d",
      "id": 1
}
-
For the auth part of the JSON, use the API token generated earlier in Zabbix. For the success conditions, use Response code: 200 (default) and set Response RegExp to search for the trigger tag created in the Zabbix trigger.
-
For the test to work correctly, the result must be “Inverted” so that when the Zabbix response matches the regular expression, the test fails and the Site Monitor conditions are met. The setup can then be tested by pressing the Dry Run button; the result should show “Test successful” (ensure the Zabbix trigger is not failing beforehand).
-
Click the Update button to save the test in the test list.
-
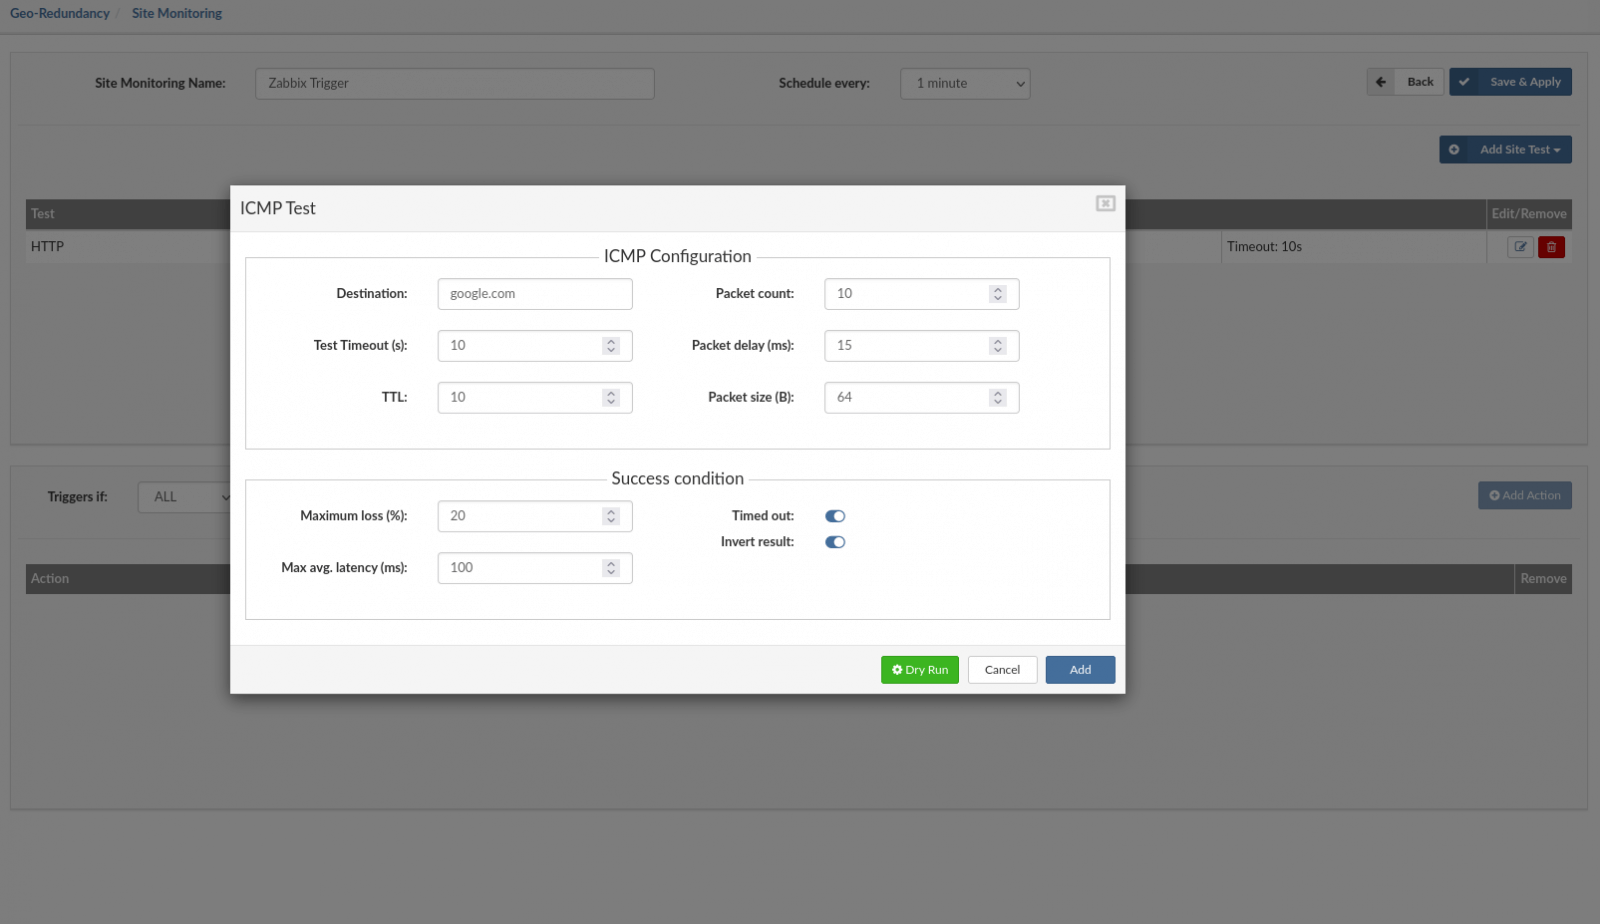
A second "self-test" should be created to ensure the Site Monitor server is up and running. An ICMP test can be used to ping Google, ensuring that if the Site Monitor server is down, actions will not be triggered. Add a new site test and select ICMP from the dropdown.
-
Set the destination domain or IP to a service that is always available (for example, Google), and invert the result so the test fails only if the destination cannot be reached from the Site Monitor server. Then click Add to include this test in the test list.
-
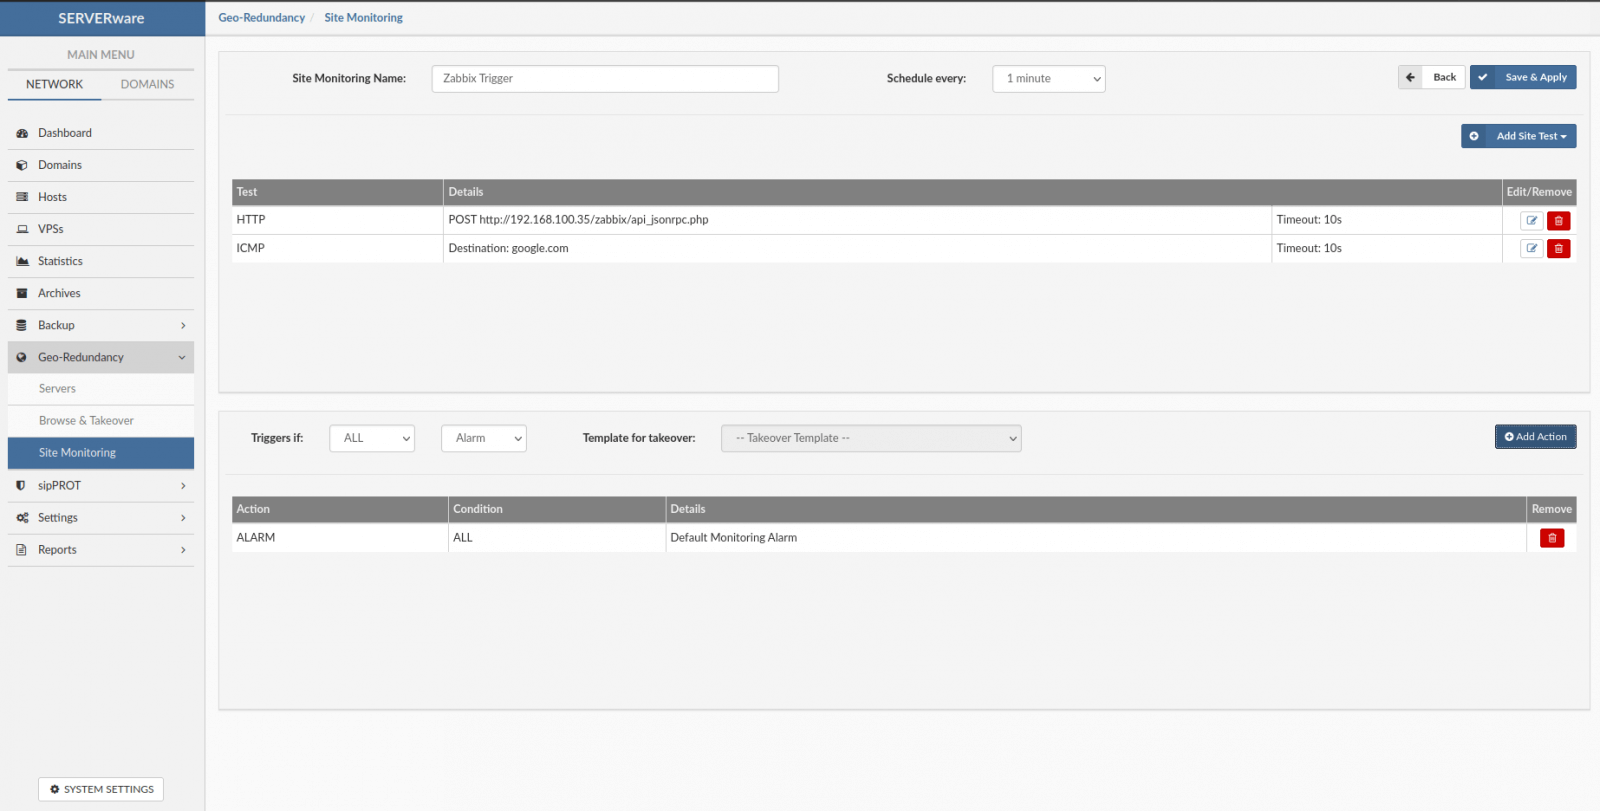
Next, actions need to be configured to define what happens when a test fails. In the lower part of the Site Monitor, under Triggers, set this Site Monitor to trigger an alarm if all the tests above fail. Optionally, an automatic template takeover can be executed when a test fails, but the takeover template must be created before selecting this action.
Set Actions:
- Triggers If: [ALL] [Alarm] and press Add the action.
-
The Site Monitor is now configured to use Zabbix triggers for executing SERVERware actions. Click Save and Apply.
-
In the Site Monitor main menu, select the newly created monitor and click Start to begin monitoring actions.
-
Create actions to be triggered if conditions are met:
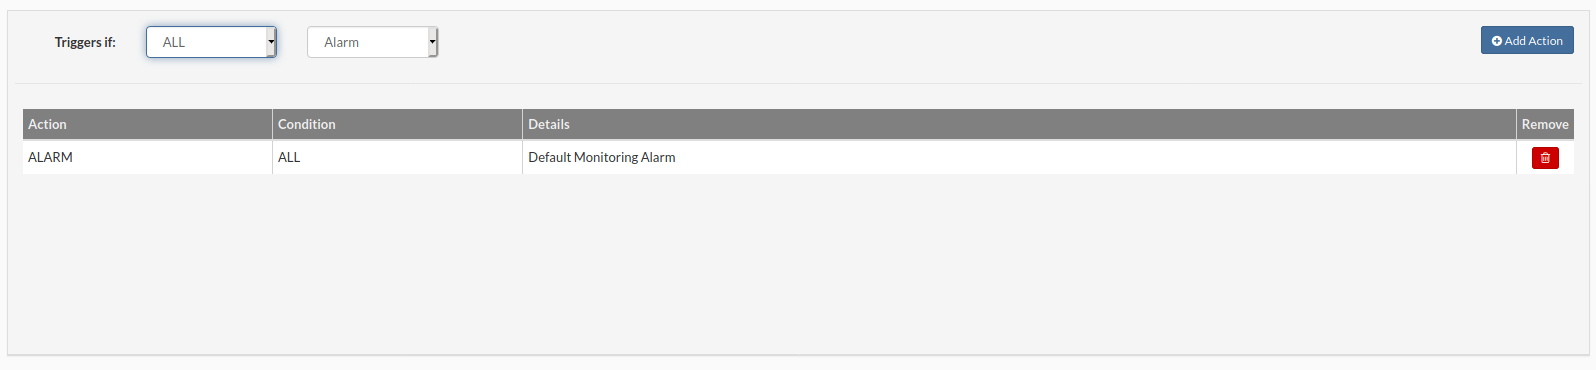
- Add Action Button : This will add action to the action list with a preselected option
- Trigers If: Two conditions available '''ALL''' and '''ANY''' and one action '''ALARM'''.
- ALL: Trigger alarm only when all tests fail for this site.
- ANY: Trigger alarm when any of the tests fail for this site.
- Alarm: Select action to trigger when conditions are met.''The Alarm will be displayed on the dashboard, an email notification will be sent to the administrator''
NOTE: Test can be edited/removed with the click on the appropriate icon. Actions can be removed only.